
During the SABR 51 convention one of the events that took place was a 64 team tournament of all time greatest teams using Dynasty League Baseball as the simulation engine. During that tournament Olin Simpson did a masterful managerial job in leading his 2006 Detroit Tigers over my 1954 Cleveland Indians.
The contest was fun and exiting, but the “one and done” NCAA tournament style brackets magnified the luck factor and led to some unorthodox results.
The 2006 Tigers were a good team, but they were certainly not the best team in the 64 team tournament. To prove this I began a project to simulate multiple seasons with these teams to identify which team was really the best!
I’ll get into my methodology first, then I’ll discus the results:
- I used the computer version of the APBA game to run the simulations.
- I used the same computer manager for most teams, the only modification I made was using managers with running/base stealing tendencies for teams who employed that skill-set prominently (e.g – 1985 St.Louis Cardinals)
- I ranked all the teams by run differential (a better indicator of dominance than wins).
- For Round 1, I broke the teams down into four 16 team groups, I randomly selected 8 teams from the top of the run differential ranking and 8 teams from the bottom. I followed the same process for the four groups in Round 1 and for Round 2. The top 32 teams ranked by wins would advance to Round 2.
- Round 2 would contain two 16 team groups, round 3 would consist of one 16 team group, round 4 would have 8 teams, round 5 would have four teams, leading to the championship round with the final two teams.
- I added a DH to teams that did not have a DH (NL teams and pre 1973 AL teams) – the hitter I added to the teams typically had an OPS around .600, so better than most pitchers, but still not a great hitter. This was necessary, otherwise the DH teams would’ve had an unfair advantage.
- I played 150 or 154 game seasons, so every team in each bracket would play each other an equivalent number of games.
- To leave no doubt about who were the better teams and who would advance to the next round, I simulated 4 seasons for each of the 16 team teams brackets in the first two rounds. I increased the number of seasons simulated to 7 in the later rounds.
- For the final two teams – I played a World Series in which each simulated season would count as one game, the first team to win 4 seasons would win the World Series.
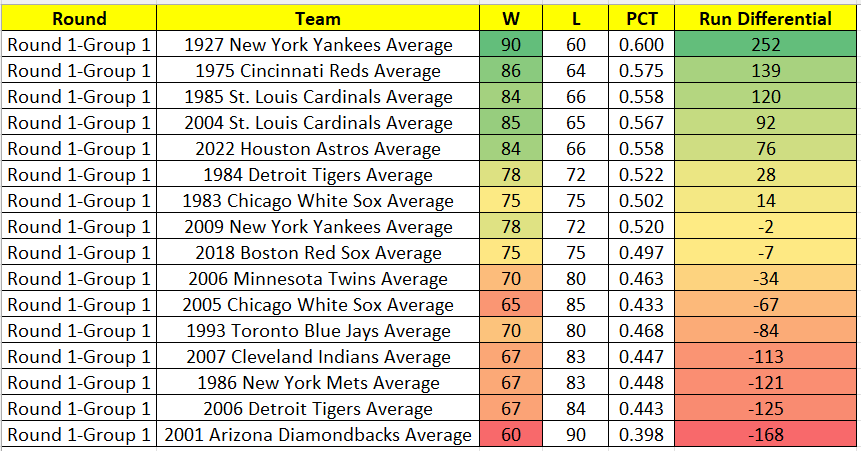
Results of Round 1 – Group 1
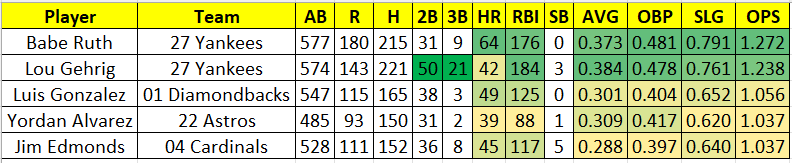
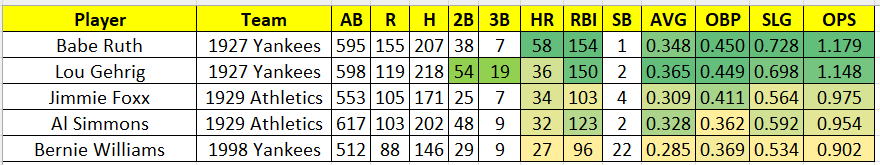
The 1927 Yankees lived up to the hype of being one of the most dominant teams in baseball history by producing an impressive +252 run differential. The biggest contributors to all those runs were of course Babe Ruth and Lou Gehrig who each compiled an OPS over 1.200!! The most disappointing team was the 1986 Mets, who won 108 games in real life, but could only muster 67 wins against this batch of great teams. As suspected, the 2006 Tigers did not fare well, tying the Mets and 2017 Indians for next to last and having the second worst run differential.
Best Hitters in Round 1 – Group 1
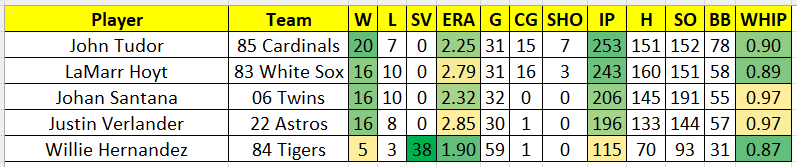
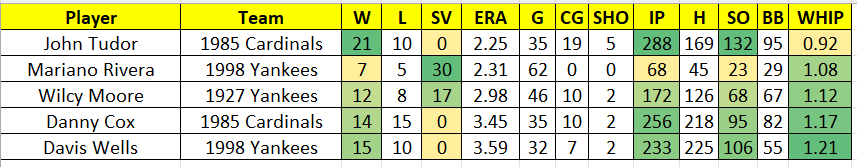
Best Pitchers in Round 1 – Group 1
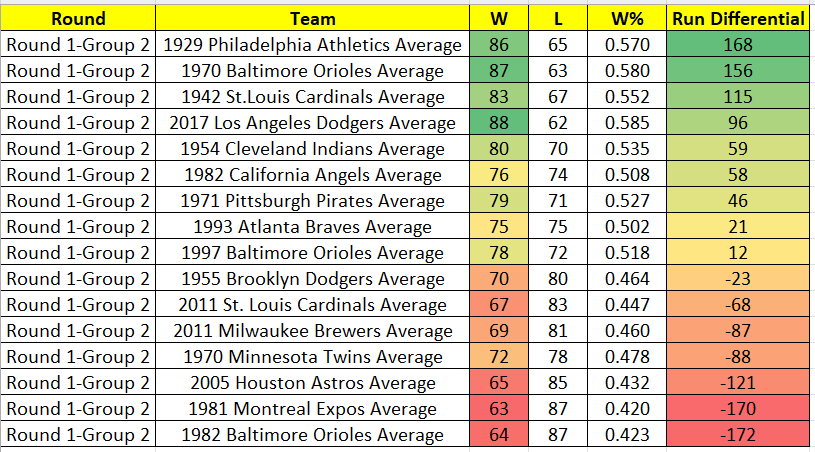
Results of Round 1 – Group 2
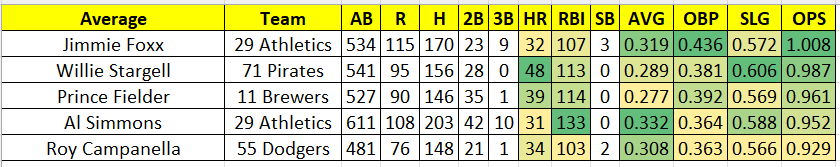
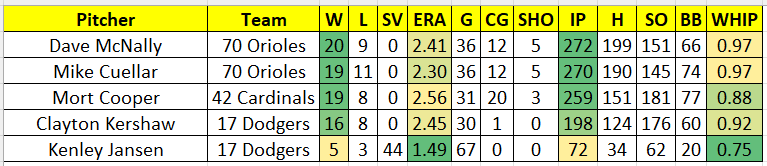
The 1929 Athletics and the 1970 Orioles were clearly the best teams in this group. The Athletics had this group’s best hitting, powered by the duo of Al Simmons and Jimmie Foxx. The Orioles led all teams in ERA, bolstered by the trio of Mike Cuellar, Dave McNally and Jim Palmer. The biggest disappointment was the 1955 Dodgers who in real life won 98 games and had a +207 run differential. The biggest issue for the Dodgers was lousy pitching, they finished 13th out of 16 in team ERA.
Best Hitters in Round 1 – Group 2
Best Pitchers in Round 1 – Group 2
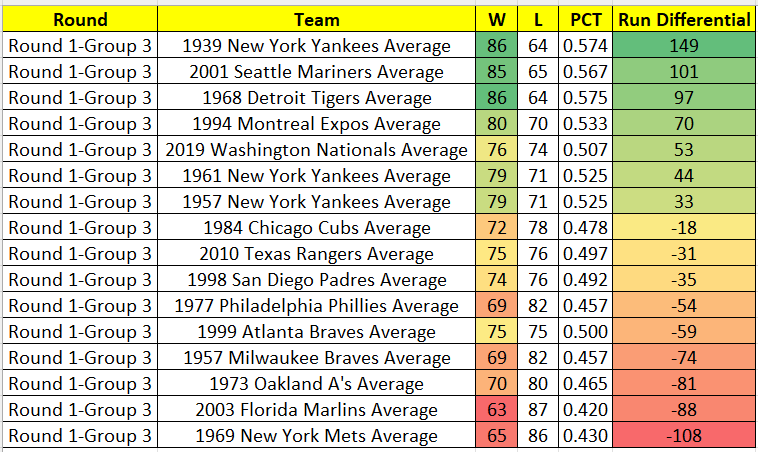
Results of Round 1 – Group 3
The 1939 Yankees had the largest run differential in baseball history (+411), so its not surprising they were the best team in group 3. Joe DiMaggio led the way with an impressive (.374/.461/.698) slash line! The 2019 Nationals (2nd best OPS) performed better than I expected, they were led by Anthony Rendon’s 38 HRs and 116 RBIs. On the other side of the spectrum, the 1977 Phillies and 1999 Braves were huge disappointments. Both the Phillies and Braves scored more runs in real life than the Nationals, but that advantage did not manifest itself in this particular group of teams. As usual, pitching was the culprit, the Braves staff ranked 12th and the Phillies ranked last in ERA.
Best Hitters in Round 1 – Group 3

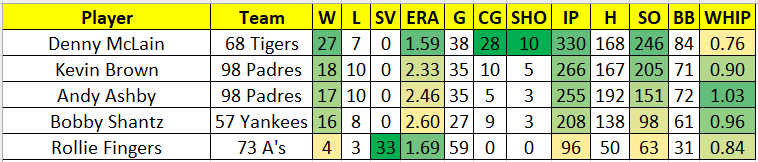
Best Pitchers in Round 1 – Group 3
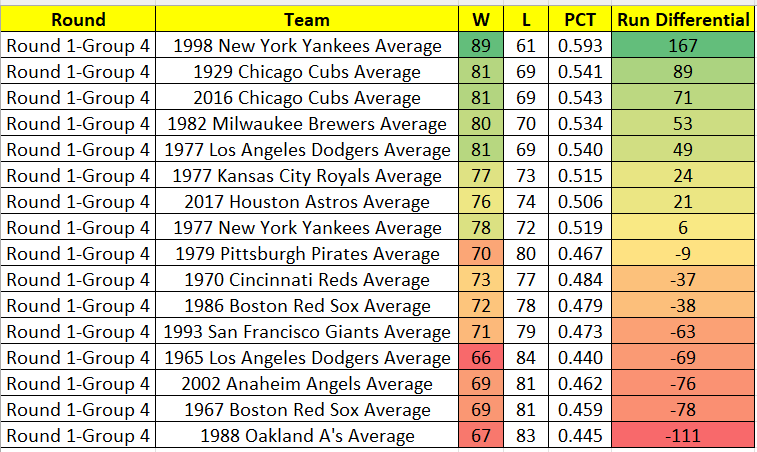
Results of Round 1 – Group 4
No surprises at the top, the three teams with the highest run differentials in real life duplicated their performance in the simulation. The Yankees topped all teams in ERA, led by the big 3 of David Cone, David Wells and Andy Pettitte, and of course …Mariano Rivera. The big surprises were at the bottom of the standings, the 2002 Angels and the 1988 A’s, both dominant teams in real life (+202 and +180 in run differential) but nowhere near those numbers in the simulation. The A’s were betrayed by their hitting (next to last in OPS), while the Angels succumbed to their pitching (14 out of 16 in ERA).
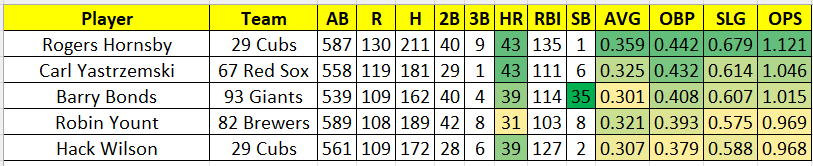
Best Hitters in Round 1 – Group 4
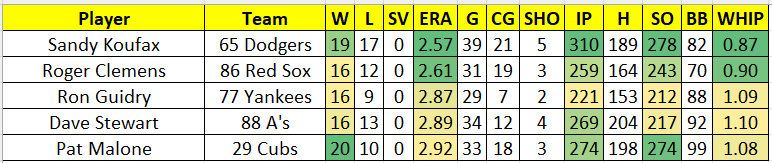
Best Pitchers in Round 1 – Group 4
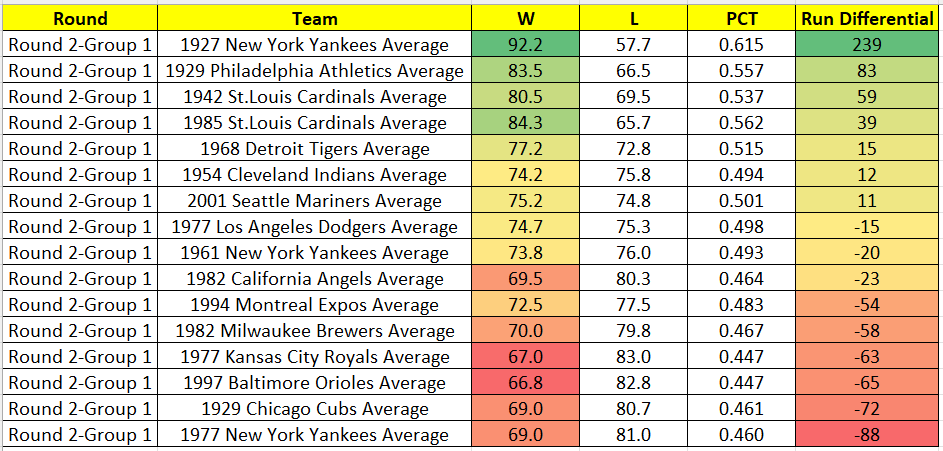
Results of Round 2 – Group 1
We proceed to Round 2 …32 great teams have been eliminated, 32 teams remain!
The 1927 Yankees again dominate the competition…and again Ruth & Gehrig look unstoppable, both players duplicated their Round 1 excellence by compiling +1.200 OPS’s!
No surprises regarding the teams that advanced, although I was surprised by the performance of the 1929 Cubs, who had performed very strongly in the prior round (they went from +89 in run differential to -72). The downfall was due solely to pitching. When comparing the Cubs performance in the two rounds, the difference was clear, the Cubs were 7th out of 16 in ERA (4.03) in round 1, but 16 out of 16 (4.65) in round2.
Best Hitters in Round 2 – Group 1
Best Pitchers in Round 2 – Group 2
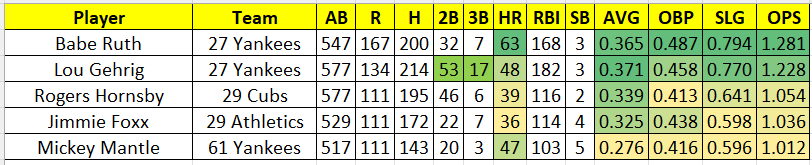
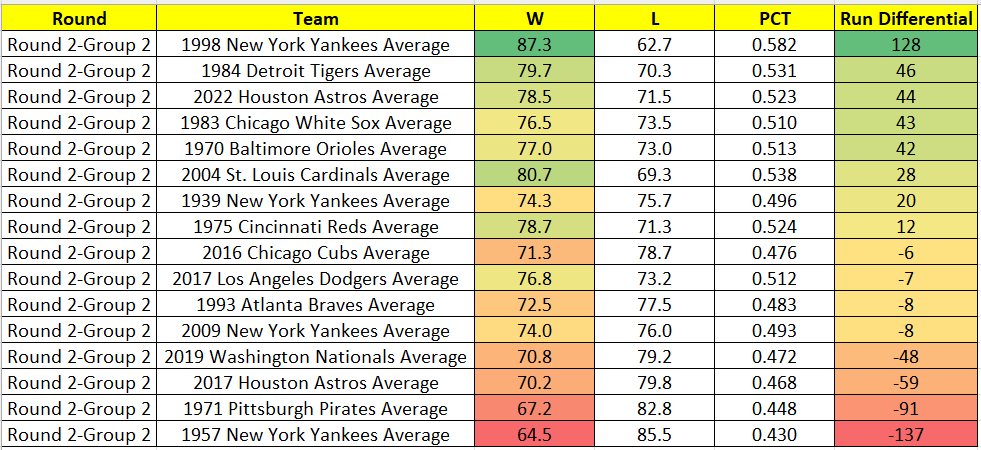
Results of Round 2 – Group 2
The 1998 Yankees were not as dominant as they were in the prior round, but still good enough to win the bracket. The 1983 White Sox were surprisingly good, propelled mostly by the group’s 2nd best ERA, a result of the excellent pitching from the duo of LaMarr Hoyt and Richard Dotson. Meanwhile, the 1939 Yankees were surprisingly bad, barely making the cut into the next round via a +20 run differential, compared to the +149 they delivered to win the Round 1-Group 3 bracket.
Now that we have reduced the pool to 32 teams, it’s interesting to see how teams that appeared dominant in the 1st round, now look vulnerable against the improved competition.
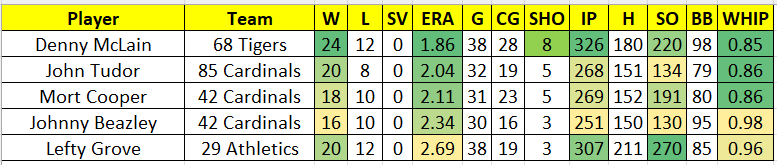
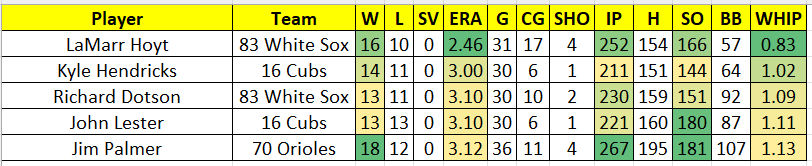
Best Hitters in Round 2 – Group 2

Best Pitchers in Round 2 – Group 2
Results of Round 3
48 teams have been eliminated….we move into the sweet 16 round!
As I filter down to the very best teams, the separation between the teams diminishes considerably. The mighty 1927 Yankees still won this round, but their run differential decreased to +135 (compared to +252 in the 1st round).
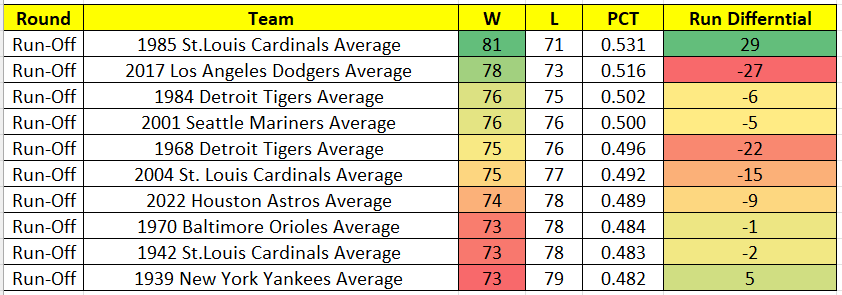
In this round (even after 7 seasons were simulated) the only teams that I thought earned advancement to round 4 were the 1927 Yankees, 1998 Yankees and 1929 Athletics. There were 3 teams that I could safely eliminate (1975 Reds, 1954 Indians, 1983 White Sox), that left 10 teams that were so packed together that I felt a run-off between those teams was necessary. So I ran simulations for 7 additional seasons between those 10 teams to see what clubs would separate themselves.
Run-Off Results – The extra run-off simulations added some clarity (the 1985 Cardinals deserved to move on) and mostly confirmed the results of the initial simulations. The one team that was omitted from the final eight, that could have easily made the cut was the 2004 Cardinals, they barely eclipsed the 1985 Cardinals and 2001 Mariners in both wins and run differential in the original simulations, but lagged behind those two teams when pitted head to head in the 7 run-off seasons, so ultimately I selected the 1985 Cardinals and 20021 Mariners for advancement into the next round.
I toyed with the idea of swapping the 2004 Cardinals for the 2017 Dodgers since the Dodgers overall run differential in the 14 simulations was worse than the Cardinals (-59 vs. -9), but the Dodgers averaged 78 wins, compared to 75 for the Cardinals, so on the basis of more wins, the 2017 Dodgers advanced to the next round.
Best Hitters in Round 3
Best Pitchers in Round 3
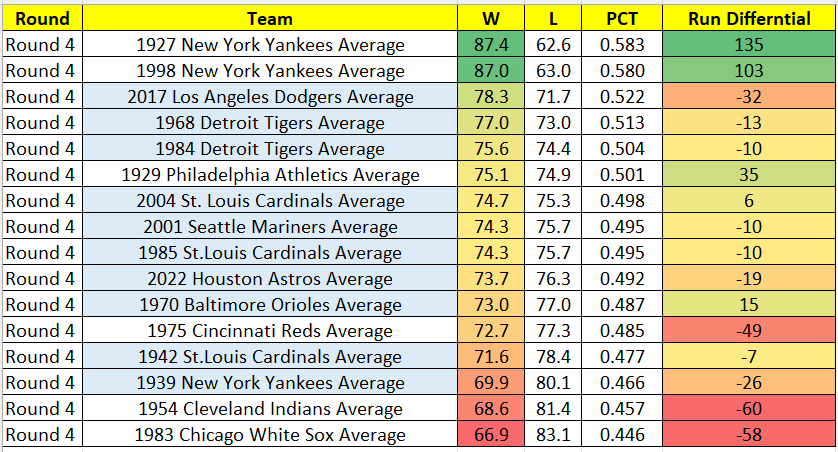
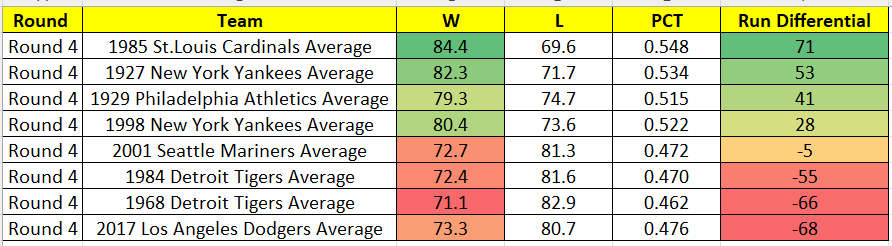
Results of Round 4
Round 4 provided the biggest surprise of the tournament. The 1985 Cardinals, who earned advancement to round 4 on the merit of their run-off performance, beat the mighty 1927 Yankees to claim the top spot in the rankings!
What has become apparent is that the performance of the teams can vary significantly based on what teams they are matched against. I know that sounds obvious, but what I mean is you want your strength to play up, not be negated by your opponents. If your advantage is in pitching, or hitting or fielding, you want your team to be the only one that dominates that skill set. In this particular batch of teams, the 1985 Cardinals were first in ERA, fielding % and stolen bases, and they were good enough in hitting (#4 of 8 in OPS), you mix all that together and the result is the best team in this group. Conversely, the 1927 Yankees were last in ERA and fielding %. Of course they were the best in OPS by a wide margin, which is what gave them 2nd place in this group.
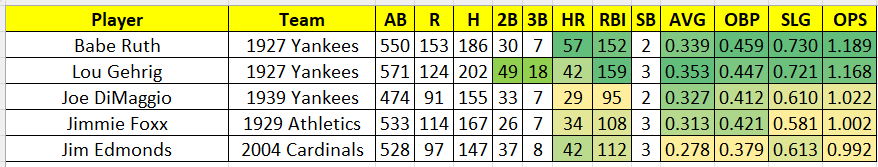
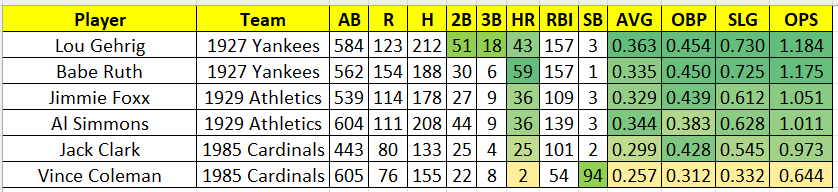
Best Hitters in Round 4
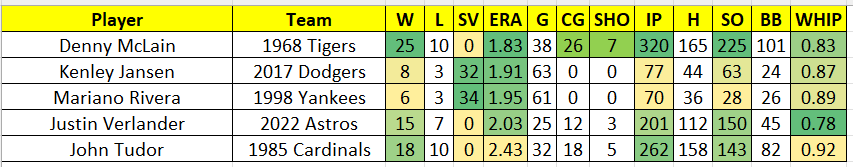
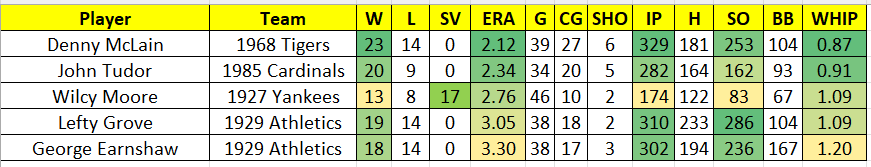
Best Pitchers in Round 4
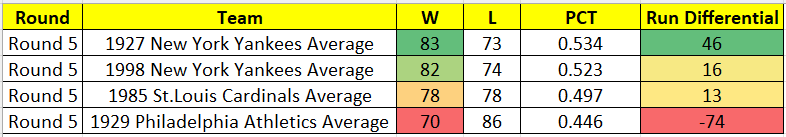
Results of Round 5
In round 5, the 1927 Yankees regained their spot at the top of the standings, but just barely. The 1985 Cardinals were essentially even with the 1998 Yankees in terms of run differential, but trailed the Yankees by 5 wins, hence the 1998 Yankees advance to the finals and the 1985 Cardinals go home. The Cardinal’s pitching dominance in the prior round against 8 teams was less pronounced against the 4 teams in this group, and while in the prior group the Cardinals were 4th out of 8 in OPS, in this group their were 4th out of 4 in OPS, this was enough to prevent them from advancing.
Best Hitters in Round 5
Best Pitchers in Round 5
Round 6 – Championship Round
In a very close World Series, the 1927 Yankees beat the 1998 Yankees in 6 seasons. To determine the champion, each season that was simulated counted as one “game” so the 1927 Yankees won the World Series 4 games to 2. Both of these teams consistently performed at or near the top in all the prior groupings, so it’s apropos that theses two teams were the finalists for the championship.
The 1927 Yankees were again led by the best duo in baseball history – Ruth & Gehrig were once again devastating – both compiling OPS’s over 1.200 for the 3rd time in the tournament.
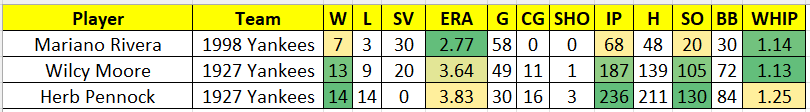
In real life, the unsung hero for the 1927 Yankees and a name you don’t hear that often when this team is mentioned is Wilcy Moore. Although Moore was not part of the starting rotation, he compiled the 2nd most innings (213) and had the best ERA (2.28). Moore pitched in 50 games, he started 12 of them, finished 30 games and saved 13 games. He pitched multiple innings of relief on 28 occasions, often pitching 3 or 4 innings at a time, furthermore he pitched 6 complete games as a starting pitcher!
Much like in real life, if you remove Wilcy Moore from the 1927 Yankees in this tournament, the Yankees do not end up as the best team, despite the heroics of Ruth & Gehrig!
World Series Results

Best Hitters in Round 6

Best Pitchers in Round 6
The topic of the greatest team in MLB history will always be fertile ground for debate. One thing is for sure, one game, or even a best of seven series will never tell you who the best team is simply because there is too much luck and randomness inherent in this beautiful game.
Fortunately there are excellent computer games like APBA that can simulate multiple seasons to give us an idea of what could have happened in these mythical match-ups.
CLICK HERE FOR A COMPLETE STATISTICAL FILE OF ALL THE SEASONS THAT WERE SIMULATED, THE EXCEL FILE CAN BE SORTED BY PLAYER, TEAM AND SEASON.
I've been a baseball fan since 1974, I was originally a New York Mets fan, but in 1989 I discovered Fantasy Baseball, in the span of a few years, I switched my allegiance from the Mets to the yearly batch of players on my Fantasy Teams. I'm still the commissioner of the two Fantasy Baseball leagues I started in 1989! In my work life I'm a Compliance Manager for a Hearing Aids manufacturer. In my spare time, I like to read, play baseball game simulations and spend time binge watching science fiction shows with my wife.
