1946 Ball Park Baseball
St. Louis Cardinals replay
December 22, 2017
A word from the league president…
In lyrics from one of his songs, Burton Cummings (former lead singer for the Canadian band, The Guess Who), sang “the only way home, is backwards in time”. For me, “home” was the 1960s and 1970s..my formative baseball years. The images are still there, the recollections of a young baseball fanatic…indelibly burned in the dim recesses of my 59-year old mind. And because of this, most of my board game replays have been from the 1960s forward. But, I think it’s fair to say that most of us in this hobby are really part gamers and part “historians”. We love the history, the stats, the comparisons. So, while I obviously wasn’t around in the 1940s to actually watch this era of baseball, I feel like I understand the game and its players and I hope to recreate life a little bit through the rolling of the dice.
So, enter Ball Park Baseball. The vehicle for this journey “backwards in time”. A game that affords us ALL the seasons of baseball history. What a tremendous library of opportunities, the opportunity to relive the golden era of the 1940s. My first foray into this decade of baseball and my first attempt to play a full season replay using Ball Park Baseball. For the St. Louis Cardinals, it was a lucrative era of baseball; 4 World Series appearances and 3 Championships. 1946 would prove to be the end of a nice run for St. Louis as there would be an 18-year drought between Cardinal World Series appearances.
And what a team of players for the Cardinals and certainly, what a pennant race it was in 1946. Stan Musial, Enos Slaughter, Whitey Kurowski, Red Schoendienst, Terry Moore, Harry Walker, et al, on the offensive side and two great pitchers of the era, Howie Pollet and Harry Brecheen. In the actual 1946 campaign it was dogfight to the end between St. Louis and the Brooklyn Dodgers. Such a fight, that at the conclusion of the 154-game season, both teams were in a dead tie for first place. A 3-game tiebreaker ensued, with the Cardinals winning the first two games and capturing the National League pennant. As for the replay, there was no need for a tiebreaker but the Cardinals and Dodgers battled it to the end, with St. Louis clinching in game 153!
As for Ball Park baseball itself, I must say there is a slight learning curve and adjustments to be made for the solitaire gamer. This game has many layers and what is amazing is that most everything that occurs in the real sport of baseball can occur in this game. It probably took me 50 games to really feel comfortable with the rules and even after 154 games, I still need to refer to the rule book occasionally. For as detailed a game as it is, it plays fairly quickly. I found the pitcher fatigue system to be exceptional and so different from many of the games in the marketplace today. The pitcher/batter controls were also a nice way to control the statistical accuracy of the game. I put together a helper program that has the charts and that seemed to make chart “flipping” a bit easier.
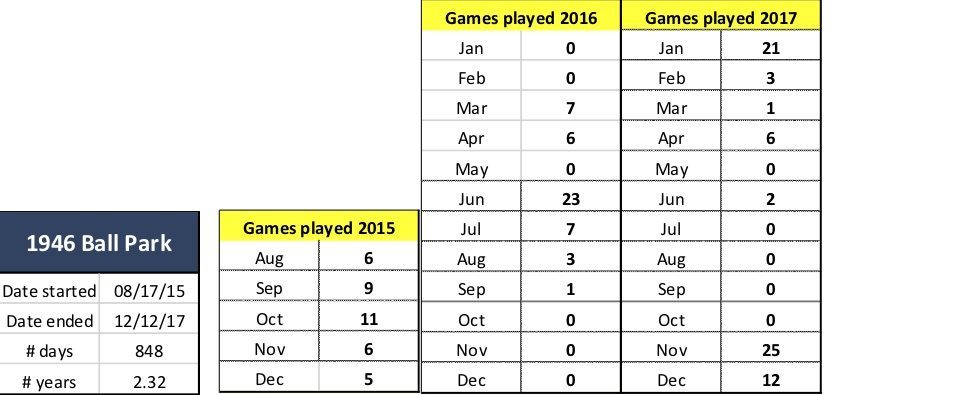
So, stay with me here as I attempt to present to you my final stats and analysis of the 1946 St. Louis Cardinals Ball Park Baseball replay. The replay started on August 17, 2015 with 37 games played by the end of the year, 47 games played in 2016 and the remaining 70 games played in 2017 (37 in November & December). I took several breaks from the replay to finish other projects, so a lot of the games were played really over a handful of months. Also, as is the case with all of my replays, all of the Cardinals’ games were played with Ball Park cards and dice while other games on the schedule were played using SOM’s computer game. Therefore, the stats for St. Louis are all Ball Park Baseball derived, while other teams are primarily SOM stats, other than the games played against the Cardinals. It’s a nice way to create league stats, standings and pennant races while not occupying a decade of one’s life in the replay of what would have been 616 games, rather than 154. It’s an exceptional tool for statistical purposes. As I’ve said many times before in my write-ups…for me, there are two major factors that compel me to play any sports board game: 1) a high degree of statistical accuracy; and 2) playability. Ball Park certainly fulfills these requirements. During this analysis there will be a lot of comparisons here to SOM, a game of which I have logged many full season replays. It is, in my opinion, one of the more statistically accurate games on the market. That being said, one could argue the emphasis of the SOM comparison. I’ll let you be the judge.
St. Louis was either in first place or tied for first place other than for 6 days during the season. But, the Dodgers were always there and near striking distance. St. Louis slipped into 2nd place on April 22, but for only one day. They would remain in first place until August 20th and fall behind Brooklyn into 2nd place for a period of 5 days. On September 21, with 7 games remaining in the season, Brooklyn and St. Louis were in a tie for first with a record of 91-56. It appeared that a tiebreaker series, much like the actual 1946 season, could be a reality.
With 3 games remaining in the season, St. Louis held a scant 1-game lead. The Cardinals would face the Cubs at home for the final 3 games and Brooklyn would complete the 3rd game of 3-game series with the Phillies and then entertain the Boston Braves for the last two games of the season. The Cubs finished above .500 in 1946 with a record of 82-71, however, they really underachieved in the replay, ending the season 19 games under .500 with a record of 67-86. Meanwhile, the Boston Braves were over-achievers, spending most of the season in 3rd place behind Brooklyn. The Braves gave the Cardinals the most trouble of any team in the division and they would finish with a record of 87-66 (compared to actual of 81-72).
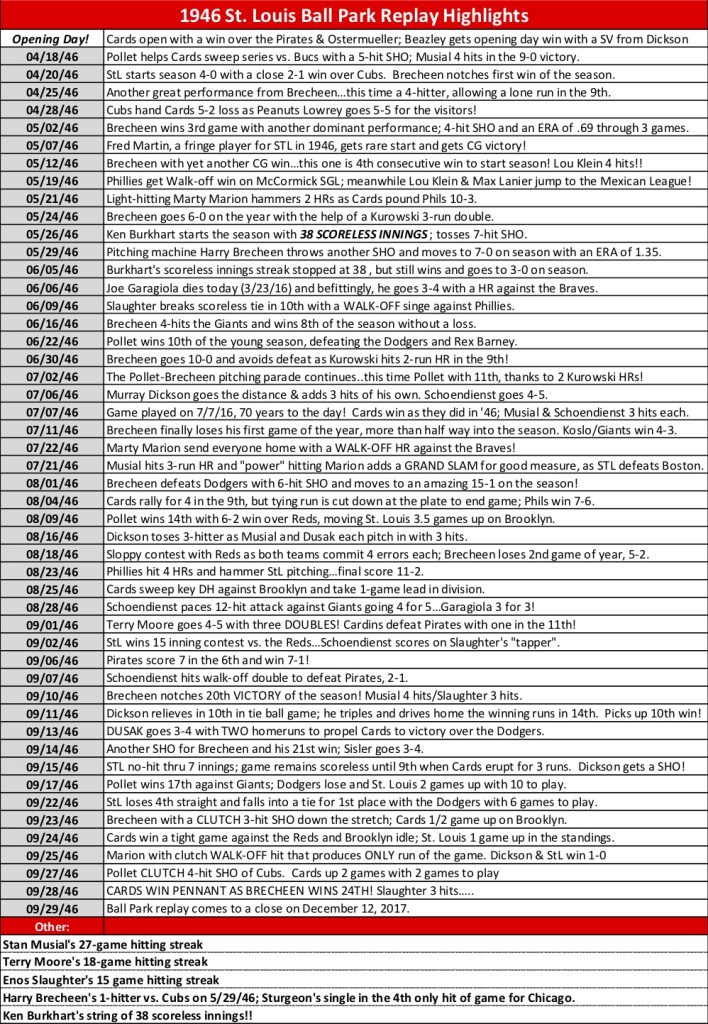
Game 152: Pollet (17-9) vs. Borowy (14-11) as the Cubs come to St. Louis in Game One of a 3-game series. It’s all Cardinals, as Howie Pollet continues his brilliant season, this time tossing a CLUTCH 4-hit SHO. St. Louis provided plenty of run support, scoring 8 runs with help from Musial (3 hits) and Kurowski (3-run HR). Final score Cardinals 8, Cubs 0. Meanwhile as Cards’ fans watch the scoreboard…Good news from Brooklyn as the Phillies post a 3-2 victory over the Dodgers! Cards now 2 games up with 2 games to play and guaranteed a tie in a worst-case scenario.
Game 153: Brecheen (22-4) vs. Erickson (9-6). The Cubs hold a 2-0 lead in the bottom of the 7th. St. Louis erupts for 8 runs in the 7th inning with the help of key hits by Slaughter and Walker. Brecheen would go 7 and get his 23rd victory of the year! Cards win the PENNANT! In what is now a meaningless game, Brooklyn rallies late to defeat Boston, 11-10.
Game 154: Munger (3-3) vs. Schmitz (15-9). In the final game of the season, with the Cardinals having clinched the pennant, St. Louis breaks a 1-1 tie in the bottom of the 7th and scores 2 runs with the help of triples by Marty Marion and Erv Dusak. Marion would finish the game with 3 hits and Al Brazle saved his 5th game of the year as the Cards win the last 6 games of the season. They would finish with a record of 97-57, one game better than their 96-58 record after 154 games during the actual 1946 season.
Below are the final standings for the 1946 St. Louis Ball Park St. Louis replay. While close to the end, the Cardinals’ 6-game streak to end the season pushed Brooklyn 3 games back.

St. Louis was 2.5 games ahead at near the half-way point of the season:

The Cardinals posted a slightly better record for the 2nd half of the season.

Here are the replay stats for each team with respect to runs scored/runs allowed.

A critical part of St. Louis’s winning the division was their dominance of Brooklyn, beating them 16 out of 22 chances and posting their best record versus any team in the league. St. Louis had a winning record against every team in the league except for the Boston Braves; they posted a .500 record against Boston, going 11-11 against them.

The Cardinals won 66% of their home games and had an exceptional record in 1-run games.

One thing to keep in mind when making comparisons of the replay data is that the Cardinals season was complete after 154 games, unlike the actual season which includes 2 additional games (156) in the statistics due to the playoff games against Brooklyn. That being said, there was only a 12-inning differential as the replay involved more extra innings games than the actual. The impact is minimal, but worth noting.
Below is a stats comparison of the team hitting and pitching to actual numbers in the 1946 major league baseball season. Once again, the replay involved two less games than actual:

The overall team batting average was extremely close and within 4 basis points, .261 vs. .265. The team hit .268 in the first 78 games and experienced a slight slump the second half with a team BA of .253. Most, if not all, individual Cardinals’ hitters had a poorer second half of the season. Interestingly enough, St. Louis posted a slightly higher winning percentage in the second half; this a function of some stellar pitching down the stretch.
The most notable deviation on the offensive side is in runs scored. St. Louis scored 69 fewer runs and had 72 fewer RBIs (in 33 fewer ABs) and yet posted one more win than they did at the 154-game point in the actual season. Extra-base hits were relatively close as were walks and strikeouts. Errors were near exact with 125 vs. 124. That being said, individual infield errors were higher while individual outfield errors were very accurate. Ball Park has infield errors which occur on the pitcher’s card, probably to balance the game statistically, albeit at the possible expense of individual player accuracy. On the whole, still good results.
Sacrifice hits were significantly “off”, but this is a function of the tendencies of the gamer. I found that a successful sacrifice was a bit more difficult in Ball Park than in other games. However, if the SOM computer game indicated “corners in”, then this is what I used when sacrificing, rather than rolling for a possible infield position via a Ball Park solitaire system.
On the pitching side, St. Louis overachieved with a team ERA of 2.88 vs. actual of 3.01. At the 78-game point, the team had an ERA of 3.17. At the 110-game point, the team ERA matched the real-life number of 3.01. But the Cardinals excelled down the stretch, allowing only 3 runs in the final 4 games of the season. Walks and strikeouts were very close to actual, while GIDP were significantly off. The key to the Cardinals’ pitching success can be seen in the Batting Average Against…opposing hitters had a .243 average during the replay, significantly higher than the .253 in the actual season.
Here are the hitting trends at various points during the season:

As you can see, the team batting average peaked at about 50 games and then waned a bit the second half. As you will see in the pitching trends, the staff seemed picked up “steam”, finishing strong and overcoming the decline in team offense.

The team ERA was at its highest point at around 78 games and significantly improved over the second half of the season. The St. Louis staff allowed 40 fewer runs in the 2nd half with substantially fewer hits and walks.

One nuance of the stats review that I like address is the difference between the replay stats and the actual stats for a specific category, then compare it to the deviation in the same stat with all the other teams. It may or may not have merit, as the other teams’ stats are derived using SOM’s computer game; so, there is really no bearing with respect to Ball Park. That being said, in my 45 years of gaming, I’ve found Strat to be pretty accurate and it’s nice to see how the replay stats “stack up” .

In the examples above, while 4 basis points is extremely accurate over the course of 5,999 plate appearances in the Cardinals’ replay, it ranked in 4th position behind 3 teams that all came within 1 basis point of the actual team batting average! As mentioned, Ball Park hitters walked more than actual by a large margin when compared to the other 8 teams. Strikeouts ranked 1st in terms of deviation from actual, which is excellent.


St. Louis scored significantly fewer runs than during the actual season. Fewer extra-base hits accounted for some of the difference, but two key Cardinal hitters underachieved in the production department that accounted for 37 fewer runs batted in. Enos Slaughter was extremely consistent throughout the replay, but ended the season with 105 RBIs compared to the monster season he had in 1946 with 130 RBIs. Musial hit 37 points below his actual average but still managed to drive in 91 runs, even though he had 103 RBIs in 1946.
As previously discussed, team errors were exceptional in comparison to actual! Individual errors will be discussed later. And finally, innings played is merely shown here to help understand the global stats comparisons.
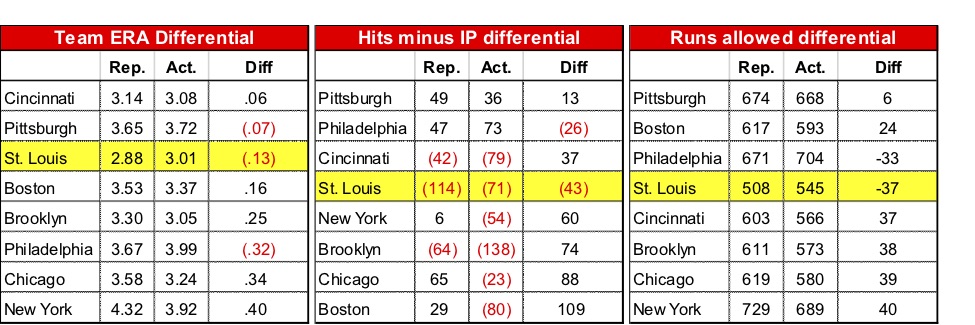
ERA is one of the more difficult baseball stats to replicate, in my opinion, in a board game. Over the years, I’ve come to the conclusion that “batting average against” is a key component that drives ERA. I’m not sure how this stat is taken into consideration in Ball Park as the formulas are proprietary, but in games such as BLM baseball for instance, the key pitching ratings use BAA calculations. With St. Louis, opposing batters hit .243 against their pitchers, which is lower than actual and partly the cause for the lower ERA of 2.88 vs. 3.01. For much of the season, St.Louis was at or higher than 3.01 in terms of team ERA, however, the staff overachieved the last month of the season. In the replay, St. Louis pitching gave up 114 fewer hits than innings pitched; in 1946 the staff gave up 71 fewer hits than innings pitched. The latter, a substantial improvement.
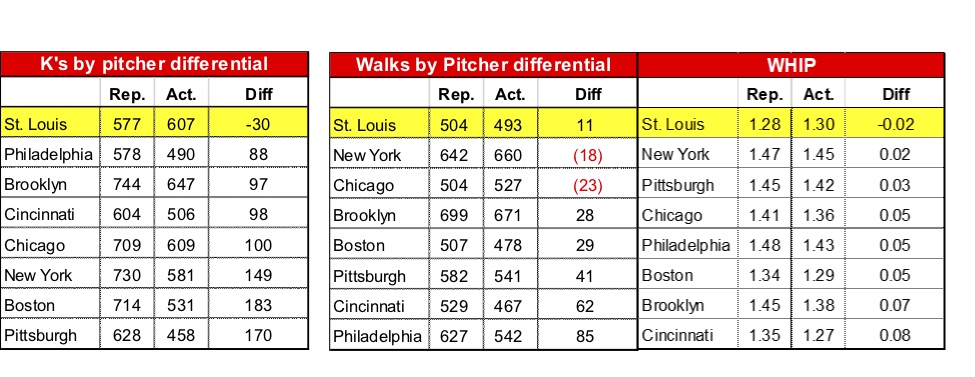
Pitcher WALKS, STRIKEOUTS and WHIP compared to actual were exceptional, ranking FIRST in these categories with respect to deviation to actual:
Individual St. Louis hitters:

The “Redhead” had a great replay, hitting over his actual average all year; he was particularly strong in the first half, hitting .305, but dropped to .288 in the second half. Overall, a 15 basis point improvement, finishing at .296. Schoendienst was 5th in the league in hits (178); 2nd in at bats (601) and 8th in doubles (29). Schoendienst committed 20 errors in the replay, which was a significant deviation from the 13 that he committed in the actual season.

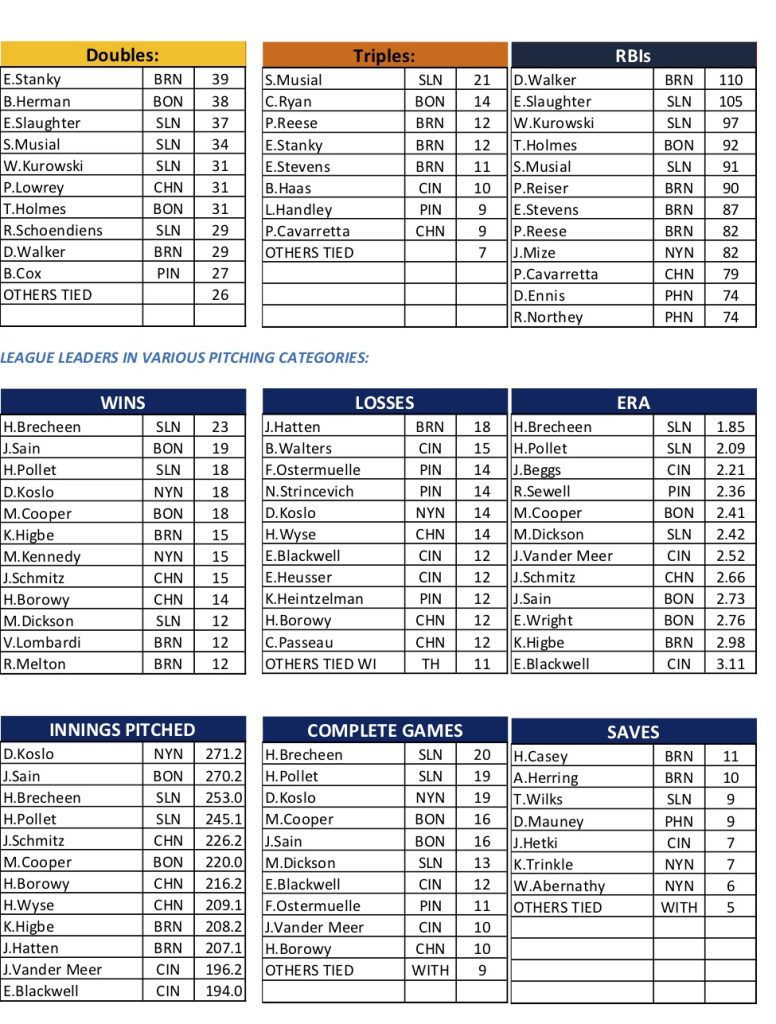
Probably the most disappointing individual performance was that of Stan Musial. All Musial did in 1946 was lead the league in hitting at .365, hit 50 doubles and drive in 103 runs! He started out strong in the replay hitting .350 after 78 games, but slumped in the second half hitting .304, inasmuch as you can call hitting .304 a “slump”! It’s just that when you hit .365, that was 61 points below his actual average. Musial fell below average in doubles, RBIs and runs scored. He did finish with a .328 average to lead the team. Errors, double plays, walks, strikeouts and triples were very close. Musial was 3rd in the league in hitting, 1st in the league in at bats (622), 1st with 21 triples, 1st in slugging % (.513), 2nd in runs scored (116), 5th in RBIs (91) and did have a nice 27-game hitting streak!

Slaughter hit over .300 for most of the replay. Extra-base hits were close; he did walk 20 more times in the replay in 10 less plate appearances. As was the case with most Cardinal hitters, Slaughter hit better in the first half of the replay. The most notable deviation is in RBIs; a great season with 105, but 25 less than the 130 he collected in 1946. Slaughter was 7th in the league in hitting (.310), 3rd in at bats (584), 4th in hits (181), 3rd in doubles (37), 4th in walks (89), 2nd in RBIs (105), 5th in HRs (17) and 3rd in total bases (279).

Whitey Kurowski played only 9 major league seasons, all with St. Louis. He had 3-4 really good seasons and 1946 was one of them. In the replay, he was Mr. Consistent all year round and always seem to come up with a clutch RBI when the Cards needed it. Kurowski would finish with 97 RBIs and 12 HRs. He finished 3rd in the league in RBIs (97), 7th in walks (85) and 5th in doubles. As a footnote, St. Louis had 3 of the top 5 leaders in doubles.

Marty Marion was a lifetime .263 hitter and a superb “glove” man. However, he did post his worst offensive year in the big leagues in 1946, when seemingly everyone else on the St. Louis team was having one of their more productive years. Marion hit .233 in 1946 and just couldn’t get it going in the replay, hitting .215 in the first half and .217 in the second half (.216 overall). He did exhibit some uncharacteristic power in the replay, hitting 7 HRs in comparison to the 3 he hit in 1946. Marion was an excellent bunter, but I just didn’t have as much success in the game trying to bunt. He did have 2-3 nice bunt hits. The one glaring stat was the 33 errors compared to 21 in the actual season. This was tied for the 3rd highest number of errors in the league.

Harry “the Hat” Walker….I remember when I was a kid listening to baseball, Walker’s name would always come as a hitting instructor “guru”. Interestingly, Walker would only hit .237 in 1946 in on of his worst offensive years. Walker was a solid outfielder with speed. Like Marion he underachieved in the replay fairly significantly, hitting only .214, although his stats were on target in the first half of the season. St. Louis traded Walker the next year to Philadelphia and all he did was hit .371 in over 500 plate appearances!! He had great years after 1947, but never returned to anywhere near that level, but posting an extremely nice .296 lifetime batting average.

Terry Moore was another very good defensive outfielder for St. Louis. Moore had a strong replay, posting a .301 batting average and much superior to his actual performance in 1946. He also had an 18-game hitting streak.

Dick Sisler was a left-handed hitting OF for St. Louis and was a rookie in 1946. He was platooned and used generally against RH starting pitching. The replay numbers were very close in batting average, hits, runs, strikeouts and errors. Sisler was traded to the Philies at the end of the next season and then traded back to St. Louis 5 years later, where he finished his career.
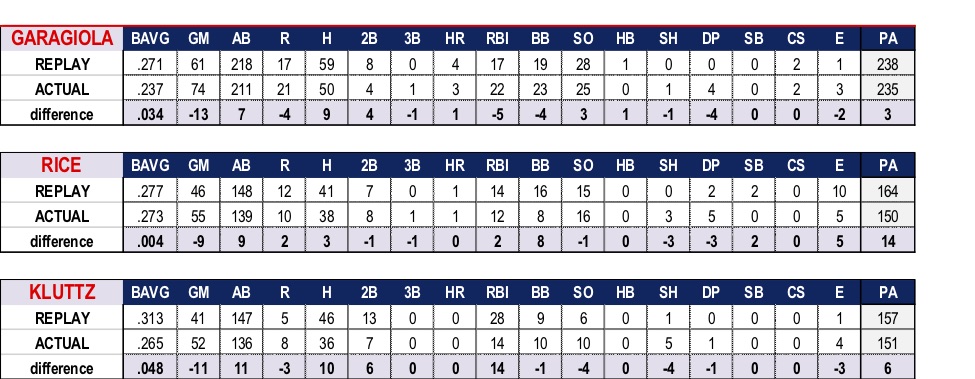
St. Louis would employ 3 catchers in 1946 with none getting the lion’s share of the playing time, although Garagiola would get around 200 ABs. Joe was a rookie in 1946 and Del Rice was in his second year of his career. Veteran Clyde Kluttz was obtained in a trade with the Giants during the season. All three catchers hit well and above their actual season averages. Kluttz was extremely productive, driving home 28 runs and hitting 13 doubles in 157 plate appearances.

Dusak was one of 3 Cardinal outfielders that was platooned during the season along with Moore and Sisler, although Moore really was kept out of the lineup in 1946 due to a knee injury. Dusak was one of two Cardinal batters to hit two homeruns in one game during the season (the other Marion). Erv played better the first half, posting a .247 average, but struggled and only hit .203 in the last 76 games of the replay.
Other less notable players and performances:
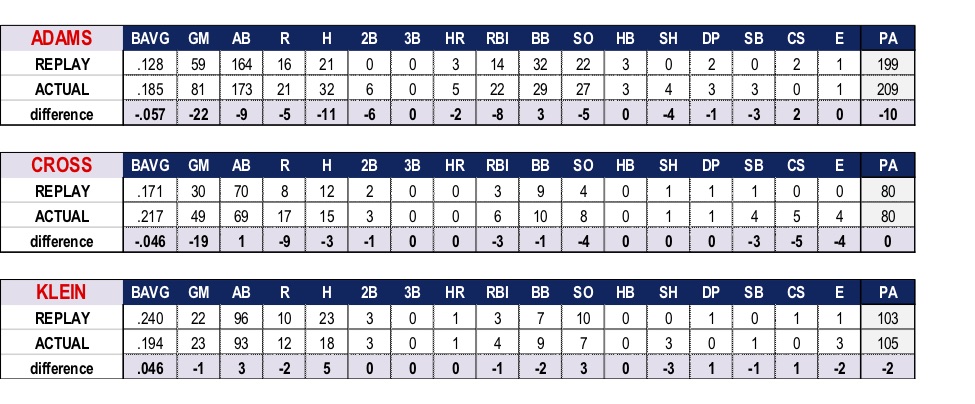
Klein, along with Cardinal pitcher Max Lanier, “jumped” to the Mexican league early in the season. He started the year playing 2B/SS and hit only .240, however this was substantially higher than the .194 average he carried in 1946. There might have been a reason he went to another league!
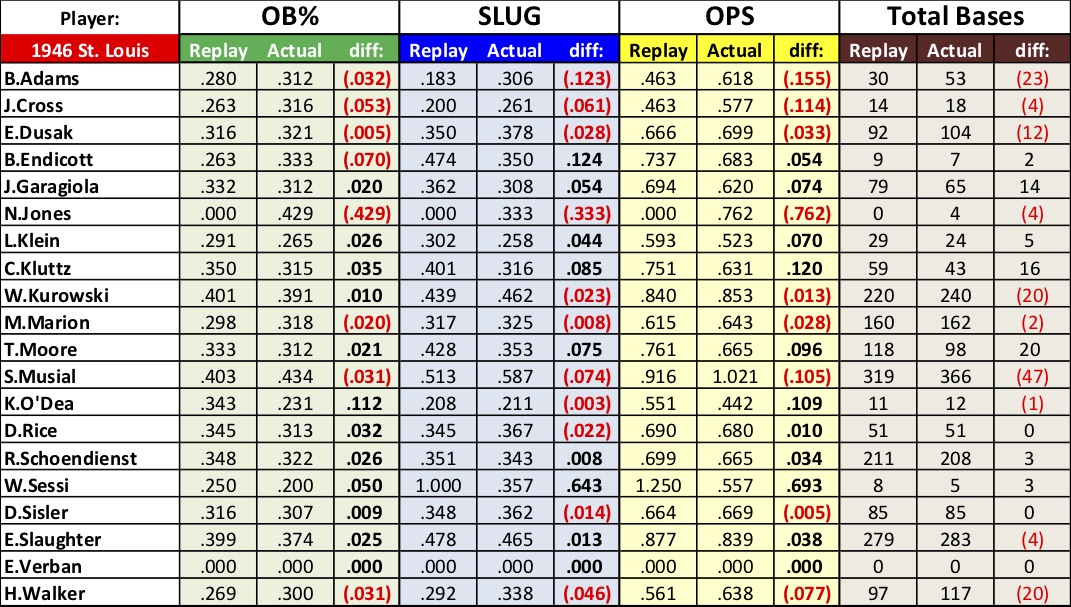
Below are some key offensive stats for each of the Cardinal batters.
Individual St. Louis pitchers:

Pollet was the “ace” of the pitching staff in 1946, pitching 266 innings, winning 21 games and posting the best ERA in the National League at 2.10. His replay performance was equally impressive as his ERA was nearly identical to the actual season at 2.09. That being said, he did not have the lowest ERA in the league; an honor reserved for his pitching partner Harry Brecheen! Pollet would complete 19 games and toss 5 shutouts during the replay, in 21 fewer innings. Pollet didn’t get to the 20 win mark, but still had an excellent 18-9 W/L record.

Harry “the Cat” Brecheen…another pitcher who had a solid career with all but one year with the Cardinals. Ironically, Brecheen never left St. Louis, pitching his last year with the American League St. Louis Browns in 1953. And boy, did he have a solid replay! A stunning 23-4 record, a league leading 1.85 ERA, a league leading 8 shutouts (with some very crucial wins along the stretch run), 20 complete games and a team-high 253 innings pitched. For his efforts, Brecheen is named the 1946 Ball Park Baseball MOST VALUABLE PLAYER!

Dickson had an outstanding replay, posting an ERA 46 points below actual and winning 12 games for St. Louis. He had 13 complete games and 3 shutouts in 18 starts!

Brazle was used as a starter and reliever and struggled most of the replay. He had a significantly higher ERA than that posted in the actual season.

Beazley over-achieved with a better than actual ERA of 3.71 and 10 wins on the replay. He went much “deeper” into games and pitcher 28 more innings than he did in the 1946 season.

Burkhart started the season by tossing 38 scoreless innings for the Cardinals, all as a starter!!!

Ted Wilks was the bullpen workhorse and was often used in save situations. As a result, he posted 9 saves compared to just the one in 1946. His ERA and strikeout totals were better than actual; the former helped by his allowing fewer HRs in the replay.

“Red” Barrett was a spot starter and reliever for the Cardinals. He pitched 2 seasons for them and was traded to Phillies in 1943 and then back to St. Louis in 1945. 1946 was his last year with the Cardinals. Barrett would struggle in most of his appearances and posted a high 5.16 ERA.

Another “Red” to go with Red Schoendienst & Red Barrett! I suppose everyone with red hair in 1946 was nickname “Red”!! Munger made some really nice late season starts and over-achieved in the replay.

Freddie Martin wasn’t “carded” by Ball Park, so I did find a card with similar season stats and Martin did get to participate to the tune of 23 innings for St. Louis. Early in the season, Martin got a rare start and pitched a complete game for the Cardinals.
Here is some league leader information for the replay; once again, bear in mind that only the St. Louis stats were generated using Ball Park baseball:
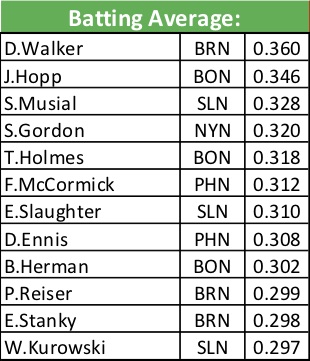
As you can see, Stan Musial finished 3rd in the batting race, significantly under his actual average of .365 in 1946. St. Louis had 3 hitters amongst the top 12 in the league. Dixie Walker of the Brooklyn Dodgers over-achieved as he only hit .319 in 1946! Johnny Hopp with Boston was a very good hitter with a lifetime batting average of .296. Hopp actually hit .333 in 1946 in 445 atbats.
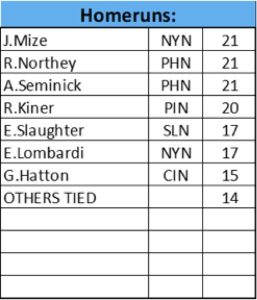
Johnny Mize, in only 393 atbats, led the league in HRs in the replay with 21. A far cry from today’s standards of HR hitters! Slaughter finished in the top 5 with 17 HRs, one shy of his actual 1946 total. Ralph Kiner actually led the league with 23 HRs in 1946; he finished with 20 in the replay.
LEAGUE LEADERS IN DOUBLES, TRIPLES, RBIs AND VARIOUS PITCHING CATEGORIES:
SEASON HIGHLIGHTS:
FINAL COMMENTS:
Well, ladies and gentlemen…another replay in the “well”. This one, my first using Ball Park baseball. What a great game! I have now completed full-season team baseball replays with 10 different board games: BLM, Strat, APBA, Dynasty, Statis-Pro, ASG, Triple Play, Pursue the Pennant, Play Ball and now Ball Park.
As a Cardinals fan, 1946 was one of those “magical” years that sports fans my age studied and read about. 1940s baseball was just such a different brand of baseball with so many great names from the past, so many Hall of Fame players. The 1946 Cardinals had some great hitters, but in this replay, it was the pitching that propelled St. Louis to their pennant winning 97-57 record. The duo of Harry Brecheen and Howie Pollet combined for 41 wins and 498 innings pitched! A great pennant race all the way to the end.
So, my journey of 848 days comes to an end. I will put Ball Park aside for a brief moment and contemplate life in my next full-season replay, whatever that may be. Hopefully, I’ll rejoin Stan and the boys somewhere down the line. And as a footnote, the only surviving member of the 1946 Cardinals is one of my favorites, Red Schoendienst. Still a part of the Cardinal ball team today.
I’ll close with the words of my hero, Jack Buck……thanks for your time, this time…’til next time. So long.
Jeff Cowan
League President
A long-time fan of the St. Louis Cardinals, Jeff Cowan has completed full season replays of Red Bird glory with ten different games. A regular participant in the Delphi Forums, he has developed an excellent understanding of baseball simulation games in his sixty years.
Lorem ipsum dolor sit amet, consectetur adipiscing elit, sed do eiusmod tempor incididunt ut labore et dolore magna aliqua. Ac turpis egestas sed tempus urna et. Cras pulvinar mattis nunc sed. Ipsum a arcu cursus vitae congue mauris rhoncus. Tincidunt lobortis feugiat vivamus at augue. Sit amet consectetur adipiscing elit duis tristique sollicitudin. Massa sapien faucibus et molestie ac feugiat sed lectus vestibulum. Duis at consectetur lorem donec massa sapien. Duis at tellus at urna condimentum mattis pellentesque. Id donec ultrices tincidunt arcu non sodales neque sodales. Id aliquet lectus proin nibh nisl. Rhoncus mattis rhoncus urna neque viverra.
-
Joe Adonahttps://sabrbaseballgaming.com/author/joeadona_awcfg2/
-
Joe Adonahttps://sabrbaseballgaming.com/author/joeadona_awcfg2/
-
Joe Adonahttps://sabrbaseballgaming.com/author/joeadona_awcfg2/
-
Joe Adonahttps://sabrbaseballgaming.com/author/joeadona_awcfg2/
