
In American sports, one player is selected among all the other players to show what being the best means. The Most Valuable Player, or MVP, election is often the occasion to debate who had the most impact on his team, who had made the greatest plays, or who had the best statistics.. Once elected, the winner will be remembered by baseball fans through history.
But how do you decide who’s going a MVP? In the MLB, the title is awarded by the Baseball Writers’ Association of America (BBWAA) to one player of each league. If you want to learn more about the process, check out the Wikipedia article!
What stands out most is that the definition of “most valuable” is left to each voter. But there’s for sure a way to determine who should be a MVP in a league? And can you actually predict it through statistics? Well, that’s the question I asked myself when I started to develop an Android game called Baseball Legends Manager.
Note : For the sake of this paper, I only worked with batters from the American League, as it represents most of MVPs. It’s already hard enough to find a correct way of deciding who’s the best batter, so imagine the difficulty of including pitchers in the process!
Batting Average? OPS Anybody?
The ancestor of the MVP award was the Chalmers award, and it was actually given to the player with the highest batting average. Well of course, there are many other things in baseball than just hitting the ball. That’s why the first MVP election process in Baseball Legends was a simple on-base percentage plus slugging (OPS) ranking.
Here’s a graph of all MVPs ranked by OPS in their MVP season:
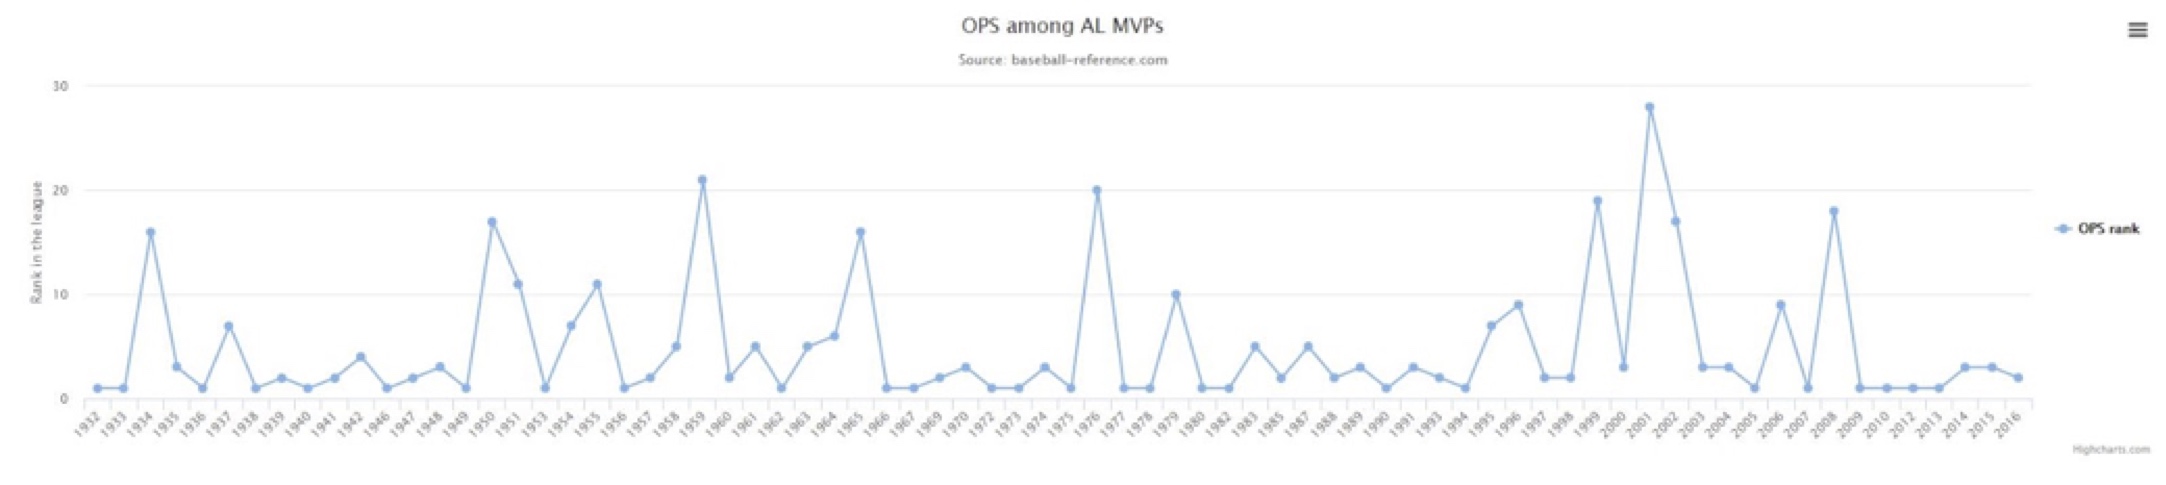
Note: OPS ranks are made with players with at least 200 plate appearances during the season.
You can already notice two majors problems: not everybody is ranked first in OPS, but worse, there are some pretty low-ranked MVPs!
Actually, out of seventy-four batters, only twenty-three have ranked first in OPS in their MVP season. That represents only 31% of them! With the average ranking (6.13), it’s not even close from being an automatic success.
Okay, I got an explanation! OPS only focuses on offense; it’s only one part of the game. Besides, since OPS wasn’t around until the eighties, a player might look better than another in offense (according to OPS at least), even if it’s not the case.
Typically, catchers would not be as good as other players offensively, but eight of them have been MVP. Even if you take them out of the picture, there’s still a lot of misses.
For example: 1950, the MVP was Phil (Scooter) Rizzuto, shortstop for the New York Yankees. Ranked 19th in OPS in the AL, with a honorable 0.857. However, he was
⦁ 2nd in hits
⦁ 3rd in doubles
⦁ 3rd in runs
⦁ 6th in batting average
⦁ 1st in WAR
⦁ 11th in RC
Here we have something interesting. Rizzuto was first in WAR. If his offense was good, his defense was outstanding. That’s one of the problems of using only an offense stats to determine who’s the best.
Let’s take a look at another player before moving on: Ichiro Suzuki, Rightfielder for the Seattle Mariners, MVP and Rookie of the year in 2001. Despite having a low OPS rank (39th with a 0.838 OPS), he was
⦁ 1st in batting average
⦁ 1st in stolen bases
⦁ 1st in hits
⦁ 4th in WAR
⦁ 9th in RC
⦁ 1st in fielding percentage (among players with at least 100 games)
This time, WAR does not explain everything. But you’ve to admit his stats are pretty impressive.
In the end, OPS is not fair. Any player with a few games played can have an outstanding OPS; so to use it as the MVP criteria requires to put a minimum of plate appearances to be elected. But once again, the chosen threshold might not be fair. For the sake of the rankings, I only considered batters with 200+ plate appearances. But for a real election process, it might lead to absurd situations.
Let’s compare a player with an OPS of 1.000 and 400 plate appearances versus a player with an OPS of 1.101 and two hundred plate appearances. If you only take OPS in account, the second player would win. In real life, the first one would probably get the award. You could still weight OPS with plate appearances, but how do you do it fairly? Maybe we can find a better statistics for the election process. In the context of a simulation, you want to get as less exceptions as possible, as they do not work well with algorithms.
Some notes on OPS
⦁ OPS average among MVPs: 0.988
⦁ OPS rank average among MVPs: 6.13
⦁ 23 MVPs ranked first in OPS during their MVP season (31%)
More Runs Please!
OPS is clearly not fair enough. So let’s consider another offensive statistics: runs created. What’s nice with RC is that it stacks up through the season, so the more a player plays, the more runs he creates. That’s one of the reason it was used to replace OPS in Baseball Legends in a second time.
Let’s see how our MVPs rank:
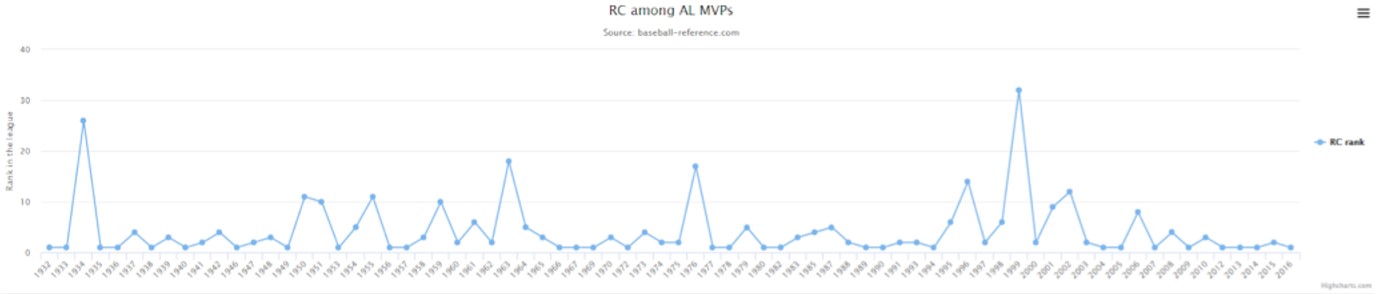
RC version used is the technical version, as described here: http://www.baseball-reference.com/bullpen/Runs_created
Results are a bit better than with OPS, but it’s still far from perfect. Only 30 batters out of 74 (40%) have ranked 1st in RC in their MVP season. We still see exceptions, but far less than. Only two batters have not been in the top 20. Phil Rizzuto is still an exception (26th), and Ivan Rodriguez in 1999, who was 32th in RC as a catcher for the Texas Rangers. Once again, if you consider WAR instead, Rodriguez was 7th. Not the best, but far better!
Once again, it only focuses on offense, so some players, especially catchers, are not fairly treated, while others like DH might have a better score (even if none of them has ever won a MVP title). But as you’re going to see, the result is not very far from WAR’s.
Some notes on RC
⦁ RC average among MVPs: 135.5
⦁ RC rank average among MVPs: 4.22
⦁ 30 MVPs ranked first in RC during their MVP season (40%)
This is WAR!
So if offense can’t explain everything, maybe WAR can help! After all, defense is considered in the calculations. Let’s see how our MVPs rank:
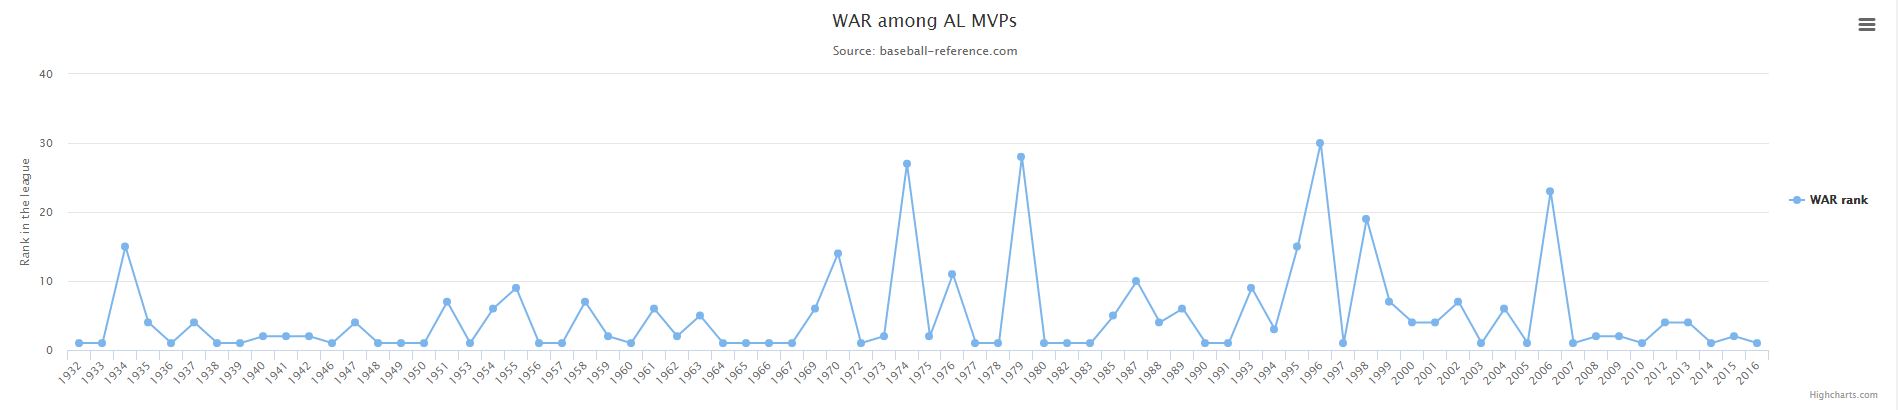
Note: Baseball-Reference WAR is used
Results are as much various as with OPS. Only 32 batters out of 74 (43%) have ranked 1st in WAR in their MVP season. That’s better than OPS, but not that much, and there are some notable exceptions too (even more than with RC). This is also surprisingly close to RC results.
However, we’ve seen that for Rizzuto, while the OPS and RC rank were low, WAR was explaining his MVP title. So if we combine all charts, here’s what we have:
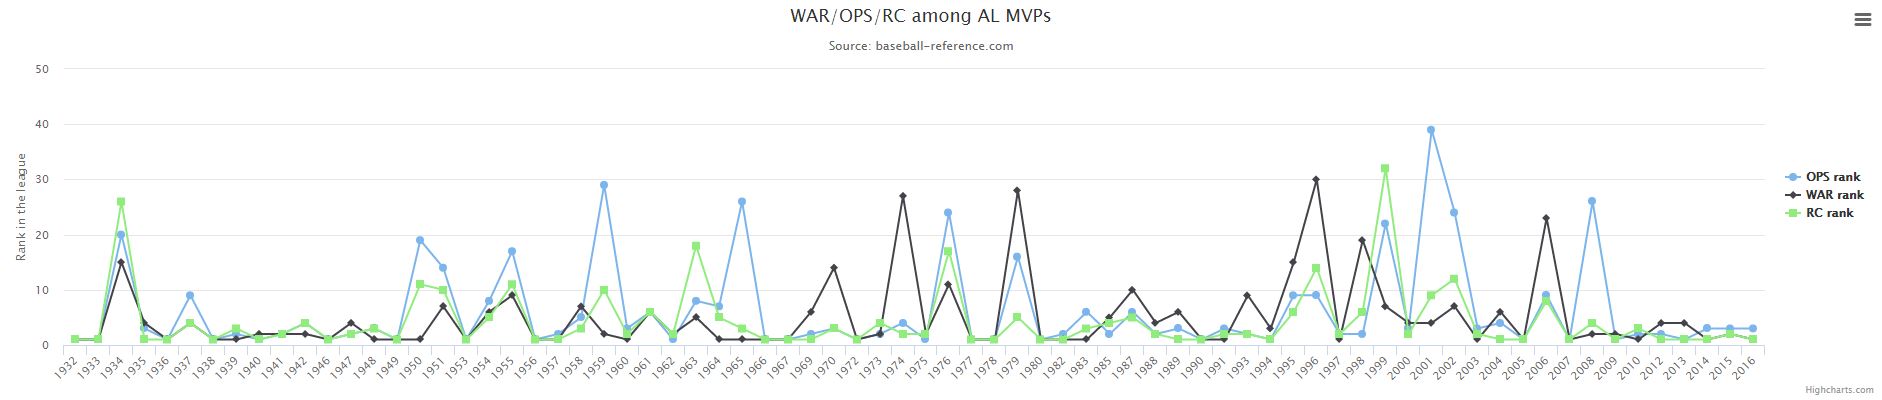
It clearly confirms that most of the time, when the OPS rank is low, WAR rank is among the best. The inverse seems to be true as well.
There are however two exceptions in AL history:
⦁ Mickey Cochrane in 1934: catcher for the Detroit Tigers. Ranked 20th in OPS, 26th in RC and 15th in WAR
⦁ Thurman Munson in 1976: catcher for the New York Yankees. Ranked 24th in OPS, 17th in RC and 11th in WAR
They’re both catchers. Cochrane helped the Tigers to reach their first pennant in 25 years while batting 0.320. Munson won the MVP title in his first year as the Yankees captain, and was batting an also impressive 0.302.
So clearly, catchers are kind of an exception. But even if you remove them from the picture, being 1st in WAR or 1 st in OPS (or both, isn’t it 2001 Giambi?) does not mean you’re going to be a MVP at all.
So WAR considers more factors, but doesn’t seem to offer much better results than RC on the MVP selection.
Some notes on WAR
⦁ WAR average among MVPs: 7.46
⦁ WAR rank average among MVPs: 4.93
⦁ 32 MVPs ranked first in WAR during their MVP season (43%)
But Wait! RC is not Weighted!
That’s right! RC is not weighted to adjust the stats according to the player position or his home park. If you do so, you might actually get better results than with WAR!
wRC+ do park adjustments, even if it does not consider positions. Let’s see if it helps us get some better results anyway.
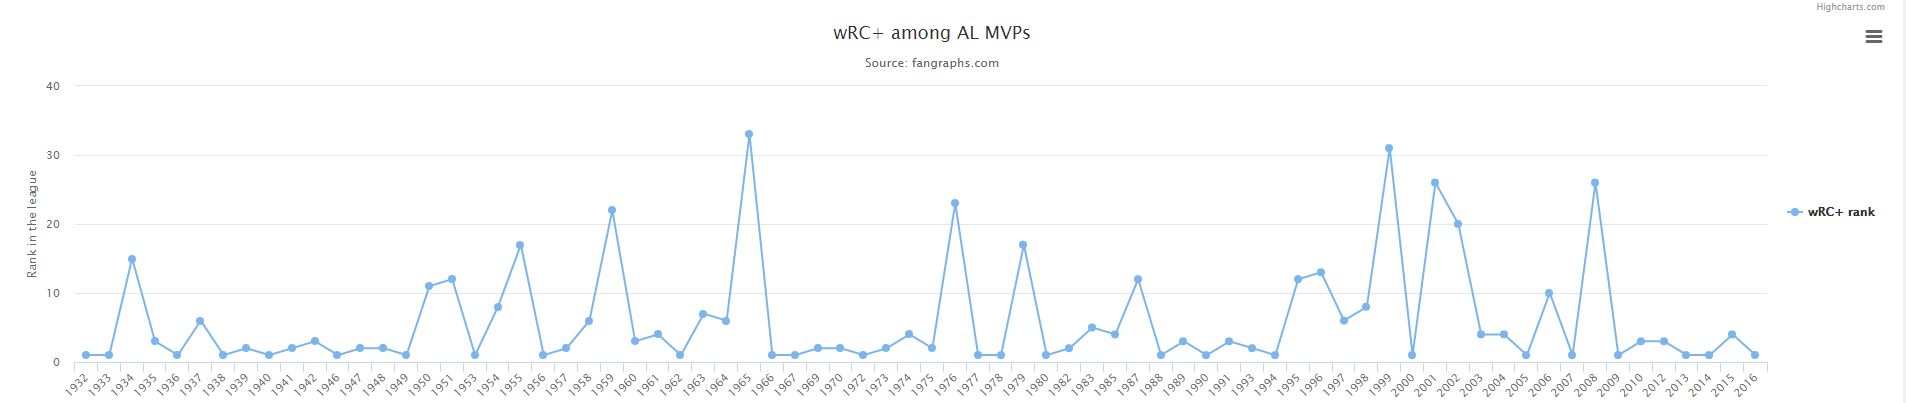
Actually, wRC+ is far less efficient when searching for a MVP player. Only 26 out of 74 (35%) have ranked first in wRC+ in their MVP season. Even if it’s a weighted stat, it seems it does not apply that much when it comes to deciding who’s the best!
It’s also worth noticing that since wRC+ takes even more factors than RC, it’s more error-prone, which might lead to even more false results in a simulation. The more you try to simulate things, the more you might create unrealistic behaviors. Keeping it simple is the best way to do efficient simulations.
Some notes on wRC+
⦁ wRC+ average among MVPs: 161.5
⦁ wRC+ rank average among MVPs: 6.01
⦁ 26 MVPs ranked first in WAR during their MVP season (35%)
So Who’s the Boss?
All these statistics are just a few among many and there are many, many other calculations you can do to compare players and see who’s the best. But actually, I’m not sure there’s such thing as a MVP formula. My guess is that the MVP title, as it is in the American League, is not only about being a great baseball player, but also to be a good team leader, or at least, have a valuable impact on your team. Having a team that reached the postseason is also a good way to increase your chances.
Of course, having a great year increases your chance of being the MVP, but it’s far from being automatic. Even if statistically, they were not the best, some players had so much impact on their team that they got elected anyway.
Cochrane had a tremendous impact on the Tigers. Munson was his team captain. Ichiro was one of the best rookies of all time, and the first Japanese position player in MLB history, leading the Mariners to their latest postseason appearance in date. Justin Morneau in 2006 helped the Twins to finish 1st in AL central and tied the record for the most RBIs in a season by a Canadian player…. You can agree or disagree. That’s what an election is about after all.
WAR and RC give you almost the same result for a MVP election. In the context of a game simulation, RC might be a better solution. It’s easier to calculate, as you only consider offense; so it’s far less error-prone. Given results are almost similar, it’s a good solution. Moreover, as RC doesn’t consider player positions, it may be possible to create a custom version of it which might give better results for the MVP election.
If there’s a way to calculate who’s going to be the MVP, I haven’t found it. I guess I missed the human factor of an election made by men and not numbers.
In SABR for a year and half, Quentin Sallat is a French software engineer especially interested in baseball simulation and its gap between theory and reality. He has also contributed to the Games Project.
Originally from Chicago and after an extensive tour of most of the western United States, Richard has resided in Denver since 2004. He attends quite a few Rockies games, especially Rockies fireworks games! When not writing about baseball, he enjoys karaoke downtown, a bit of poker, and a bit too much of his iPad. His writing has appeared on ESPN.com, The Hardball Times, and Beyond the Box Score. He has also covered the Rockies as a credentialed writer as the founder of Rockies Zingers and as a writer for SBNation’s Purple Row.
